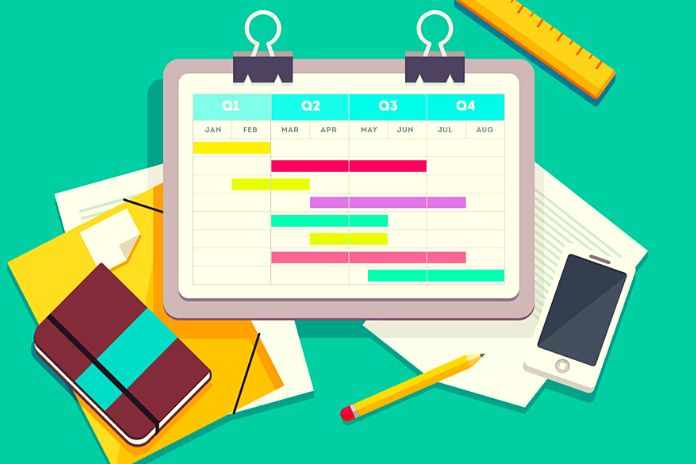
The Gantt Chart is a visual project management tool that illustrates a plan and helps teams gain greater control over their stages. This type of chart, also called a Gantt Chart, is helpful in almost all sectors of the economy and is widely used in the most diverse areas of industry.
What Is A Gantt Chart?
The Gantt Chart is a bar chart that illustrates a project’s timeline. It can be used to plan schemes of different sizes and stages.
Its main objective is to show when each step should begin and end and indicate the order in which they must be completed.
What Is The Gantt Chart Used For?
Analyzing a Gantt Chart, it is possible to know the following:
- The tasks that must be carried out;
- the duration of each one of them;
- Who is working on each task;
- When each task starts and ends;
- How tasks group, overlap, and link to each other.
Where Does The Gantt Chart Come From?
The Gantt Chart has been used since the early 19th century. However, at that time, the diagram did not yet have the name by which it is currently known – it was called Harmon gram.
It was in the 20th century that the model inspired the American Henry Gantt to create the graph as we know it today. At the time, he intended to avoid delays in factory production, helping industrial supervisors.
Today, in addition to industries, the Gantt Chart is also used in project management for other types of companies, such as technology, communication, and offices in general.
What Are The Advantages Of The Gantt Chart?
The Gantt Chart has a significant advantage: it facilitates the creation of complex plans, especially those involving multiple teams and different deadlines.
See below for other benefits that the diagram can bring to those who use it:
- Provides an overview of the project: the chart acts as a roadmap, listing all of its milestones, duration, and expected start and end dates.
- By having a very visual format, it is possible to have an overview of all this very quickly;
- Shows the relationship between tasks: by stipulating dates and dependencies, it is possible to understand how each part of the work affects the others, which helps to identify and resolve conflicts even before the start of task execution;
- It helps to distribute responsibilities: as it is very visual, it is possible to use the Gantt Chart to distribute tasks among members, using, for example, different colors for each person;
- It facilitates monitoring the project’s progress: the graph enables the monitoring of managers. It allows the entire team to visualize and order their daily tasks based on the information presented by the diagram.
What Are The Disadvantages Of The Gantt Chart?
On the other hand, the Gantt Chart brings with it some challenges that make it not always the ideal tool for your project, so before adopting it, you also need to know its disadvantages:
- Time-consuming setup: creating a Gantt Chart is not always a simple task, even more so when the project involves many steps;
- Difficulty in adding details: once ready, it is more complex to add new information or present possible changes in the plans.
How To Make A Gantt Chart
After reviewing the advantages and disadvantages of the Gantt Chart, if you decide that this is the best tool to track your project, it’s time to get your hands dirty and start creating your diagram.
See how to do this step by step:
- List the activities: one tip is to break extensive activities into several small activities to make it easier to follow each one;
- Identify the relationships between them, indicating which ones need others to be completed for them to start;
- Determine the deadline and those responsible;
- Define the format of your chart: it can be done manually, with post-its, or digitally, with spreadsheets. There is also the possibility of using an ERP system!
Excel
If you don’t want to create your Gantt Chart manually, one option is to use Excel or another spreadsheet program. You can create formulas and dynamic graphs to show the time for each task and the percentage of execution.
ERP
With a complete ERP, you can create the Gantt Chart automatically. To do this, list the tasks, put start and end dates and register other important information, such as the responsible person and the relationship between functions. With that, the system draws the diagram and delivers it ready for you.
How To Use A Gantt Chart?
The Gantt Chart can be used in different ways. In project management, it indicates which activities must be performed and the precedence relationship between them. Thus, everyone can visualize their responsibilities and deadlines.
In the production line, the diagram is adopted to analyze bottlenecks, identify idle machines, and even assist in purchasing inputs.
What Are The Parts Of A Gantt Chart?
The structure of the Gantt Chart is simple, having only three parts:
- The vertical axis indicates the activities or tasks to be performed;
- The horizontal axis, which means time;
- The activity bars mark the period in which each of them must be developed.
Conclusion
The Gantt Chart is a simple but valuable tool that can bring many advantages to those who use it. To provide even more efficient management, it is essential to combine the diagram with other tools, such as an ERP system, where all company information is recorded, organized, and transformed into reports with crucial data for planning future projects!
Also Read: What Is The Ideal CRM For My Company?

